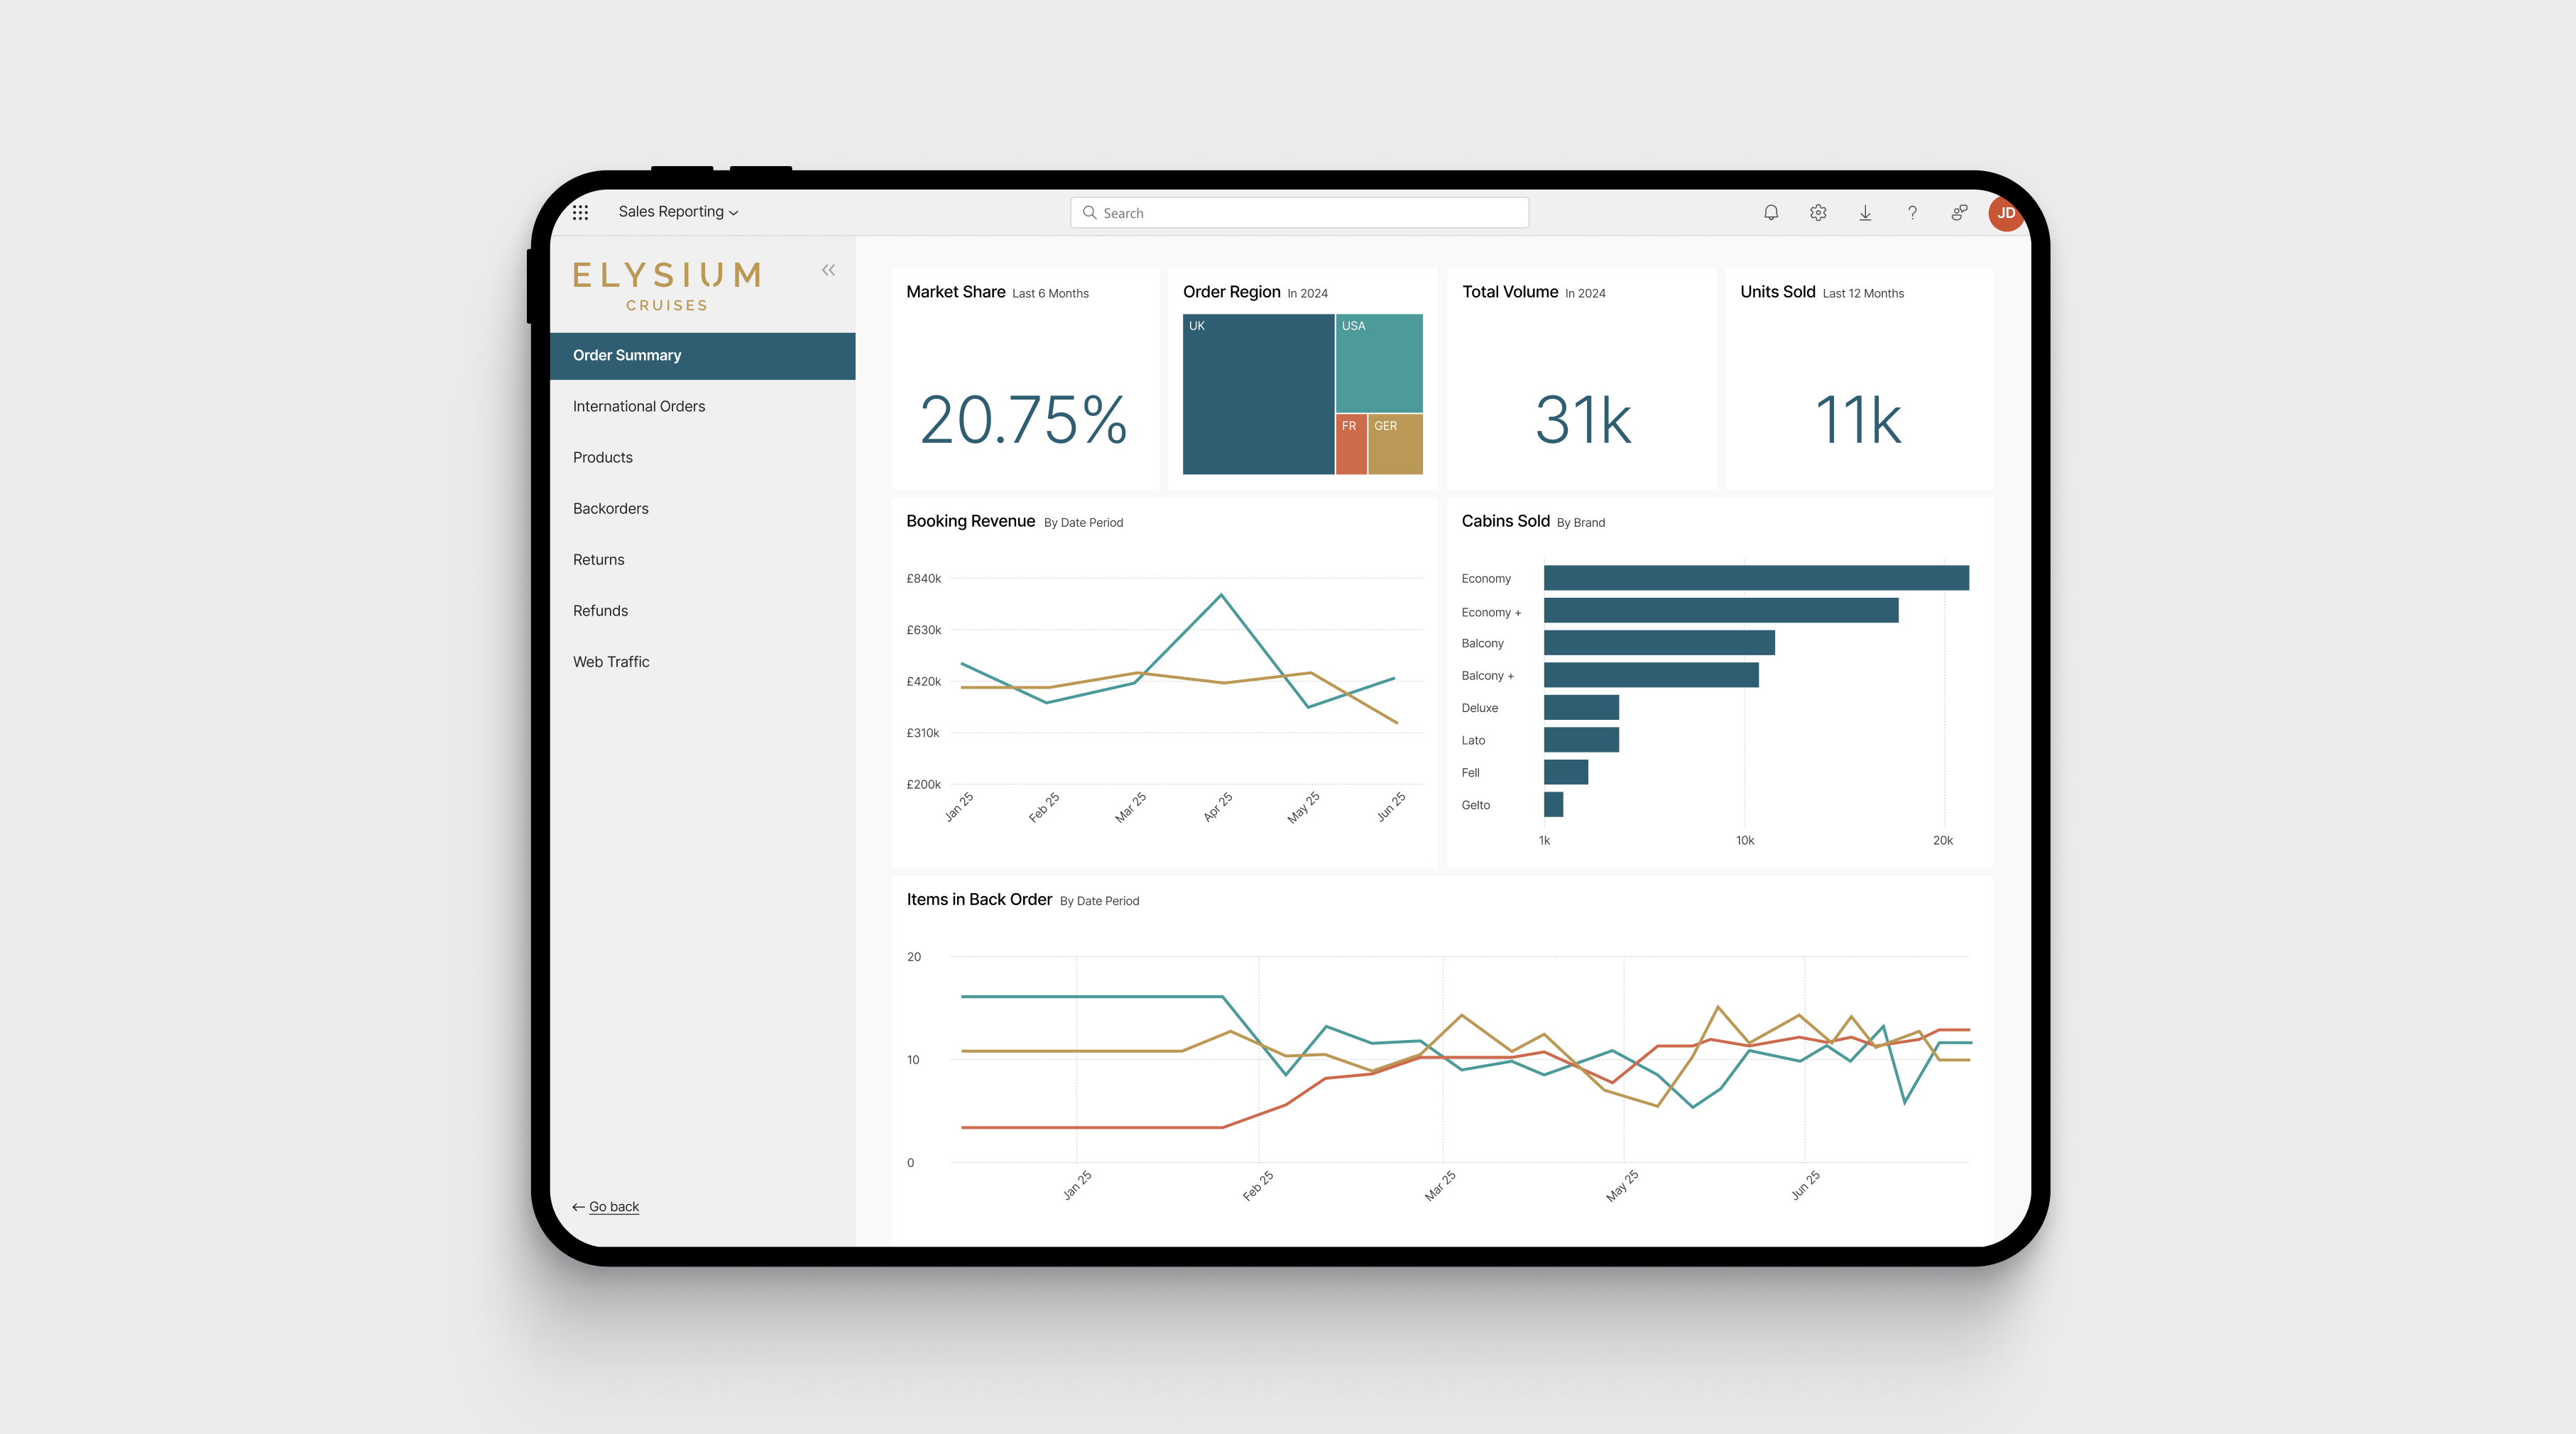
Reports that help you understand your key cruise-specific metrics
All your data in one place
With a huge amount of data being generated from cruise booking systems and websites, we can offer you a fully-fledged reporting suite, built in Power BI to help make sense of all this data.
We use Power BI for its speed and flexibility. Not only is this a great solution to operate and understand your business from, but it means we can plug any extra data sources in to cover your entire business. Such as the revenue information from your ship’s PMS.
As we are very experienced in the cruise world, we can help guide you with what data to look, as well as understand the terms and usual KPIs involved in the cruise world.

The types of data reporting we do:
We have a range of ways that we do our reporting, but the usual report suite would start with reports such as the following:
- Daily booking position
- Per Diem (Per Person Per Day) rates by:
- Cruise
- Destination
- Channel
- B2B agency
- Cruise length
- Sales by Cruise
- Sales Distribution
- Option to Live Conversion by Cruise
- Sales Momentum
- Daily Bookings
- Sales by Staff Member
- B2B agency performance
- Cabin Availability
- Cruise Cabin Inventory
- Yield Analysis
- Promo Code Uses
- Historical Booking Position (year on year)
- Excursion sales
Looking to refine your key cruise-specific metrics?
Our systems can help you achieve that Talk to us
More services related to Cruise Specific Reporting
We have built and managed core business technology in the cruise industry for over a decade
Cruise Reservations System (Tiller)Tiller is our Central Reservation System or Booking Engine specific for the cruise industry
Cruise WebsitesCruise-specific websites that make booking easy and intuitive. Always e-commerce first.
View All Services